|
APIs, concepts, guides, and more
|

|
APIs, concepts, guides, and more
|
View and track RapidCode objects all in one place.

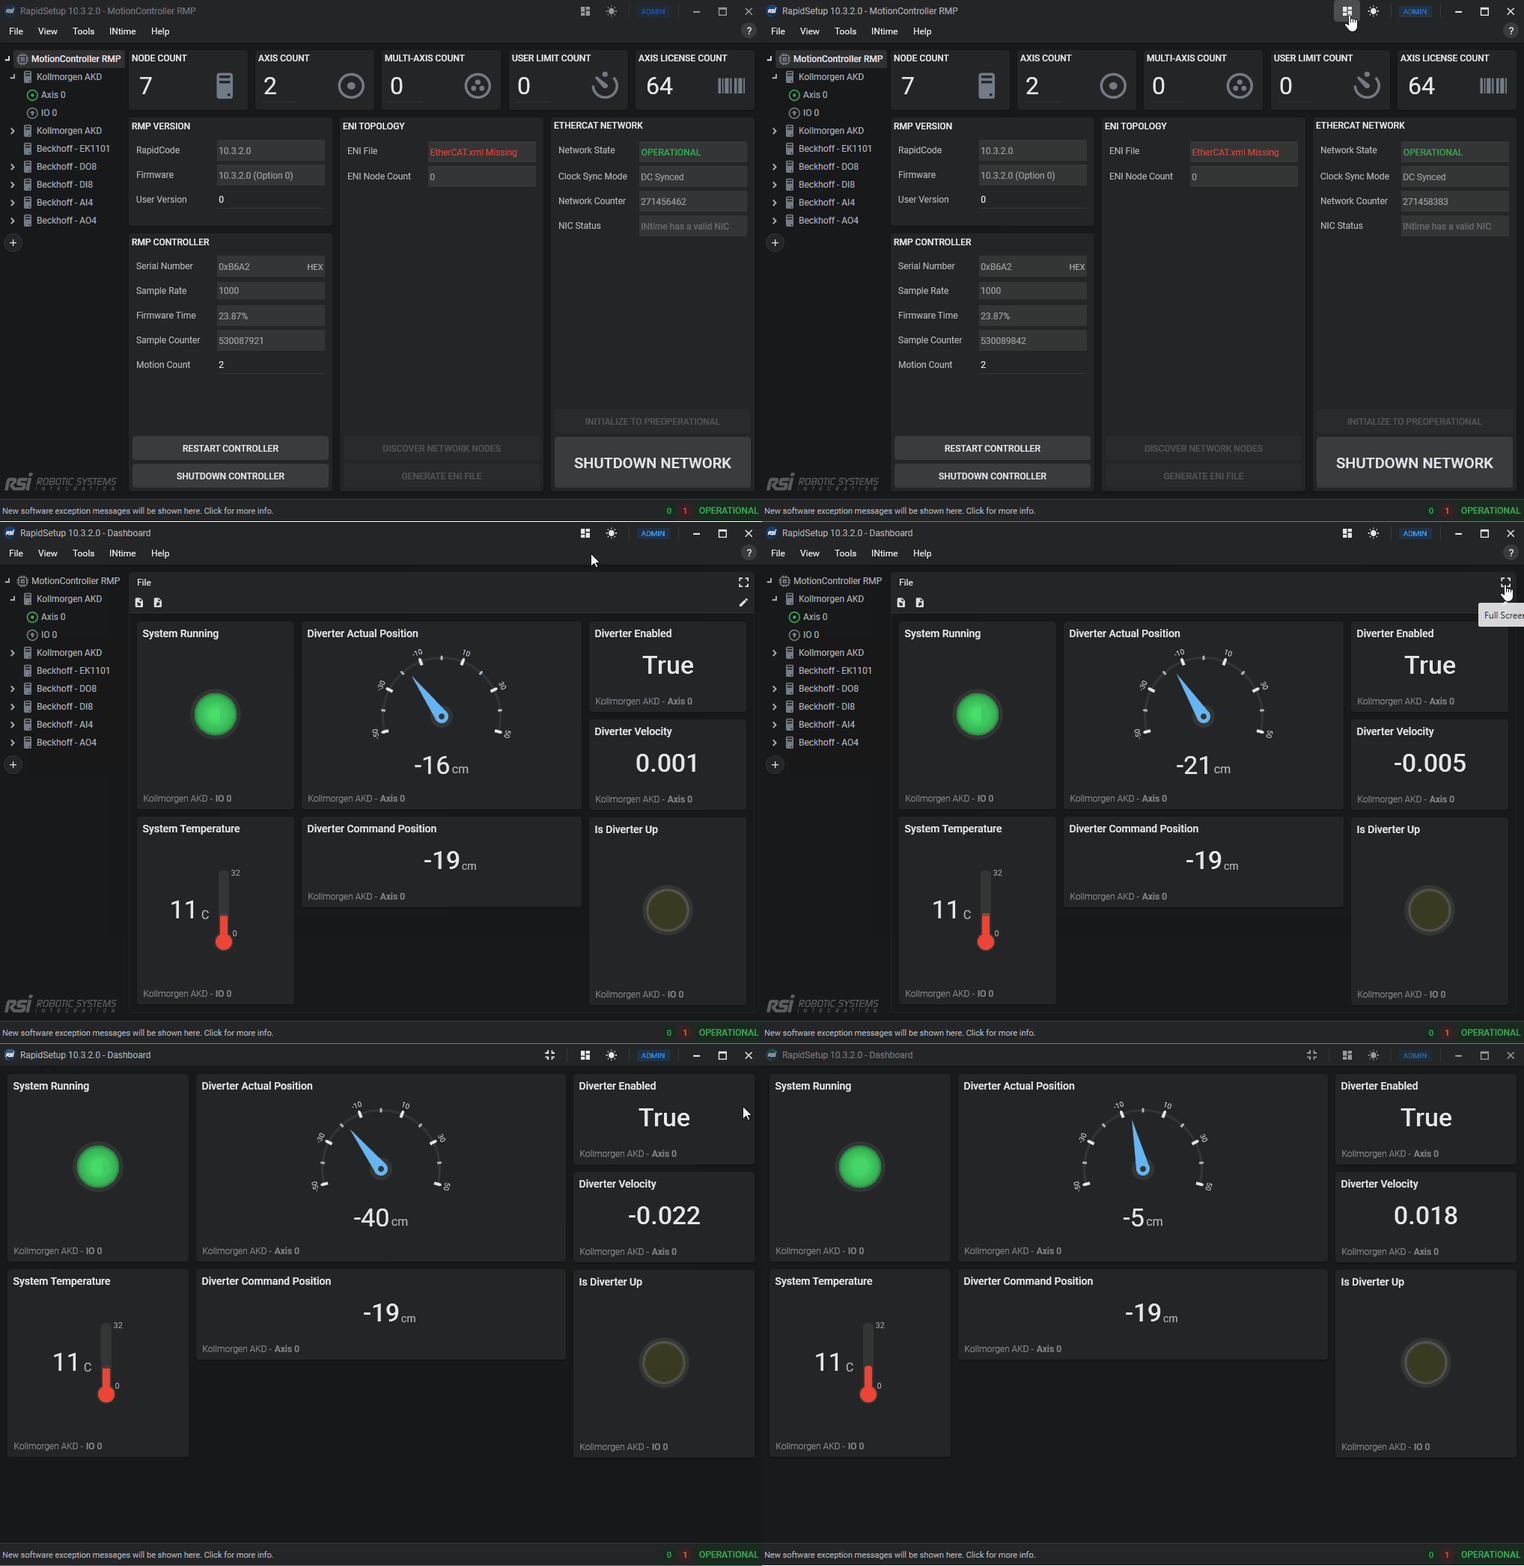
The Dashboard allows you to visualize data in real-time. it lets you gauge information across RSI APIs and objects effortlessly. All while allowing you to import/export it to keep different RapidSetup instances across your organization the same.
Dashboard
-- Rows
---- Columns
---— Widgets
| Action | Info |
|---|---|
| Edit | Allows you to add/move rows and widgets. |
| Delete | Allows you to delete the entire Dashboard. |
| Export | Allows you to save your Dashboard as a file. |
| Import | Allows you to load an existing .dashboard file. |
| Expand | Allows you to visualize the Dashboard without other RapidSetup items. |
Widgets represent different objects within an API (Currently only supporting RapidCode API). Each widget contains different fields and values since each widget has a different data source.
.png)
.png)
Hover widget to see its toolbar appear. Click edit to edit.
.png) Make changes, then click edit again to save/exit.
Make changes, then click edit again to save/exit.
| Field | Info |
|---|---|
| Name | Title of the widget. |
| Source | Shows where the data/value is being taken/displayed from. |
| Display | Represents the graphical form of the value. Numeric, string, and bool values all have different displays. |
| Multiplier | A numeric value gets multiplied by this. |
| Decimals | Choose how many decimal places you would like to display. |
| Units | If assigned, this will display next to the value. |
| Scale | Enlarge or reduce the size of your widget display. |
| Minor | If non-zero, it will display ticks every X times. |
| Major | If non-zero, it will display bold ticks every X times. |
| Min | This sets the minimum value the gauge will count from. |
| Max | This sets the maximum value the gauge will count to. |
Displays allow you to visualize data in many different ways and troubleshoot problems instantly. Zoom in, change colors, add a multiplier, and more.
.png) Label (available for all datatypes)
Label (available for all datatypes).png) Numeric Circular Gauge (available for numeric values only)
Numeric Circular Gauge (available for numeric values only).png) Numeric Linear Temperature Gauge (available for numeric values only)
Numeric Linear Temperature Gauge (available for numeric values only).png) LED (available for boolean values only)
LED (available for boolean values only).png)
.png)
.png)
.png)